John Lincoln

The Best SEMrush Reports In 2018 (A Guide For Savvy Marketers)

Face it: you need to monitor analytics to make sure that your website is performing well in the search results. That’s why you should frequently check your SEMrush reports.

In this article, we’ll cover the SEMrush reports in some detail. That way, you can gain a better understanding of how well your website stacks up against the competition.

These SEMRush Reports 
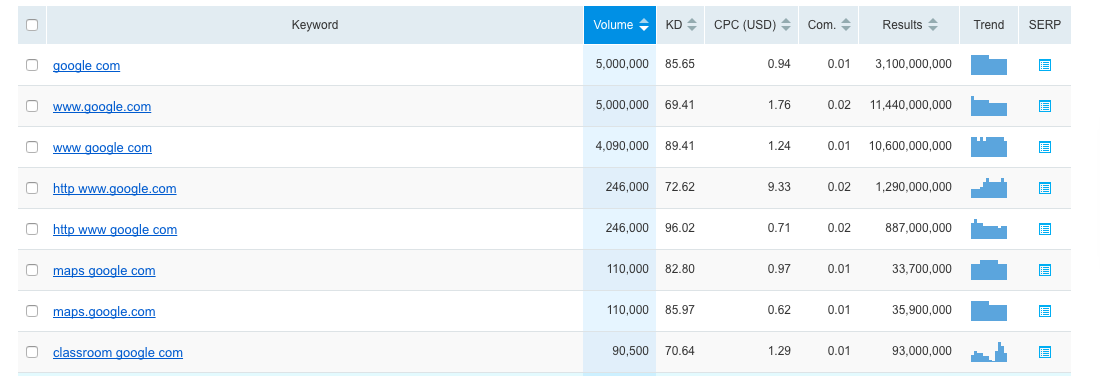
Those reports contain a wealth of information about your domain, keywords, competitors, and pages. They’ll also uncover some new advertising opportunities.
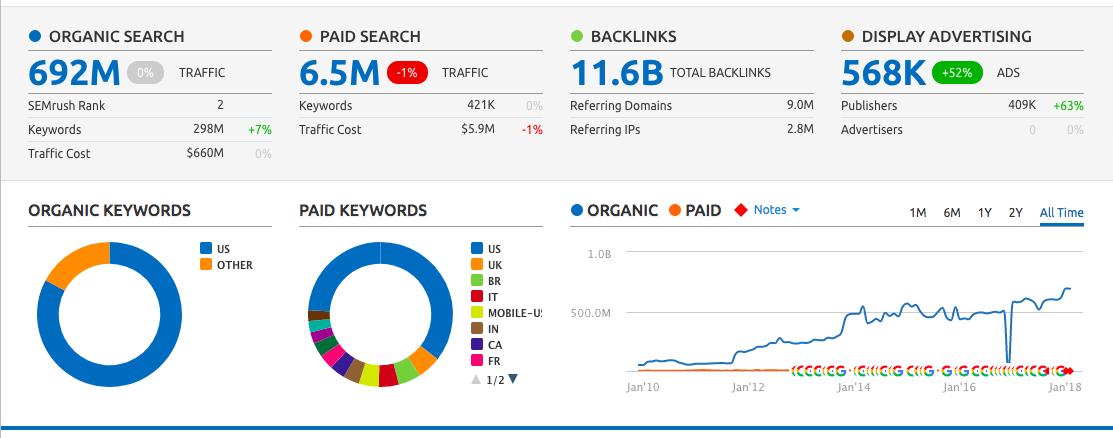
Three Kinds of SEMrush Report Categories

SEMRush divides its reports into three broad categories: Domain Analytics, Keyword Analytics, and Projects. Domain Analytics are specific to a domain. You type in a domain name (for example, “google.com”) in the search bar and SEMRush provides you with valuable information about it. Keyword Analytics is keyword-focused. You type in a keyword related to your brand (for example, “marketing automation”) and SEMRush shows you details about that keyword. Project reports are usually domain-specific. If you’re a professional who’s handling SEO for numerous clients, you’d usually set up one report for each client. Unlike Domain Analytics and Keyword Analytics, projects are “saved.” That is, SEMRush “remembers” the projects you’ve created so you can easily check them the next time you log in. Let’s now take a look at each of the SEMRush report categories in turn.

SEMrush Report – Domain Analytics

If you’re in SEMRush, at the very top of the dashboard, you should see a search bar. Click on the dropdown just to the left of that search bar. In the dropdown, select “Domain Overview” and then enter the name of your domain. Click the “Search” button on the right. After some processing time, you’ll see the overview of your domain. That’s the “executive summary.” It includes bits of info derived from the other reports.
Domain Overview from SEMRush Reports
Here are the other reports:
  • Organic Research
  • Backlinks
  • Advertising Research
  • PLA Research
  • Display Advertising
  • Traffic Analytics
We’ll look at each of those in detail.

SEMrush Report – Organic Research

Take a look at the left-hand menu on the screen. You should see “Domain Analytics” towards the top and several items underneath. Note that “Overview” is currently highlighted. Click on “Organic Research” just below it to bring up the Organic Research report. At the top of the report you’ll see the total number of keywords you have in the top 100 (or top 10 pages) of the Google search results, the amount of traffic you can expect in the next month, and the estimated price of the keywords you’ve ranked in Google AdWords. In the middle of the report, at the top, you’ll see a line graph. That graph shows your traffic for the specified time frame. Note that the default time frame is “All Time.” On the right, next to the line graph, you can see what percentage of your traffic comes from reviews and featured snippets. Below the top section is a table labeled “Organic Search Positions.” That shows your most popular keywords. By default, the keywords are ranked in descending order based on the percentage of traffic they bring to your site. You can sort them by other metrics, such as volume, position, and results. Pay particular attention to the last column in that table (“Last Update”). That tells you the last time that SEMRush “looked” at the search results for that keyword. That info usually isn’t updated every day, so you’re likely looking at slightly outdated data.
Organic research results in SEMrush reports

Other Organic Research SEMrush Reports

When you clicked on “Organic Research” on the left-hand sidebar, you might have noticed several items appear below it. Those are additional reports you can look at. Here’s a list of all the Organic Research reports:
  • Positions
  • Position Changes
  • Competitors
  • Pages
  • Subdomains
  • URL
The Positions report is the default report that we just looked at. Click on “Position Changes.” That report will show you new keywords you’ve added to the Google top 100 as well as keywords that you’ve lost. It will also show you organic position changes in a table. Next, click on “Competitors” on the left-hand menu under “Organic Research.” That report will show you how well your site is performing against your competitors. At the top of the Competitors report, on the right, you’ll see a graph. That graph shows your organic reach (on the y-axis) and the number of keywords you have in the Google top 100 (on the x-axis). That same detail is displayed for a few of your top competitors. The Competitors report also shows a table of your competitors. It includes information about how many common keywords you share with them, how much traffic they get from organic search, and how many paid keywords they’re using. Next, click on “Pages” below “Organic Research” in the left-hand menu. That report will display a table that shows your top pages based on the percentage of site traffic. The “Subdomains” report is only something you need to worry about if you’re using subdomains. You probably won’t need it. The URL report will give you critical stats about a specific URL on your site. You shouldn’t use it for your home page. Instead, use it to gain some insight about one of the articles on your blog.

Discover Backlinks with SEMrush Reports

Go back to the menu on the left-hand sidebar and click on “Backlinks” below “Domain Analytics.” That will show you the Backlinks report. That report is SEMRush’s answer to Majestic. It gives you key data about who’s linking to your site. Pay particular attention to the “Domain Score” and “Trust Score” stats towards the top of the report. Those are similar to Majestic’s Citation Flow and Trust Flow metrics. The higher those numbers are (especially Trust Score), the more likely it is that you’ll rank well for keywords related to your niche. That report will also show you the total number of backlinks, the number of referring domains from those backlinks, and the number of IP addresses that are pointing to your site. If you scroll down, you’ll see a wealth of additional info, including stats about new and lost backlinks, the percentage of backlinks that are nofollow vs. follow, and the various types of backlinks.
Backlinks overview using SEMRush reports

SEMrush Reports Provide Advertising Research

We won’t dive too deeply into the advertising reports here since we’re mostly concerned with organic reach. However, if you’re an active advertiser on Google AdWords, you can learn a lot from those reports. Click on “Advertising Research” under “Domain Analytics” in the menu on the left-hand sidebar. The report that appears will give you some detail about your advertising efforts. Note: if you aren’t doing any advertising, the report will likely be blank. The report shows you how many keywords you’re using in your advertising efforts, how much traffic you’re earning from the ads, and the cost of that traffic. There’s also a line graph on the top right-hand side that looks very similar to one in the Organic Research report. It shows your advertising reach over time. At the bottom of the report, there’s a table that shows your advertising keywords with important metrics. As with the Organic Research report, there are numerous sub-reports associated with Advertising Research. The default report is the Positions report. Here are the other reports:
  • Position Changes – shows new and lost keywords as well as paid position changes
  • Competitors – compares your advertising efforts with those of your competitors
  • Ad Copies – displays your ads as they appear to Google users
  • Ad History – shows you a calendar so you can see how specific keywords performed over time
  • Subdomains – shows ad traffic by subdomain
  • URL – shows ad traffic for landing pages

SEMrush Reports – PLA Research

The “PLA” in PLA Research stands for “Product Listing Ads.” The report is intended for e-commerce sites that sell products online. If you don’t sell products online, you won’t need to worry about the report. If you do sell products online, you’ll only need to look at the report if you place PLAs on Google. Otherwise, you can ignore it. To view the report, click on “PLA Research” under “Domain Analytics” in the left-hand sidebar. As is the case with some of the other reports we’ve looked at, the PLA Report is broken down into sub-reports:
  • Positions – shows you the positions of your PLAs over time
  • Competitors – offers key details about the PLAs of your competitors
  • PLA Codes – shows details about PLA codes

Track Your Display Advertising with SEMrush Reports

If you’re running banner ads, you’ll be interested in the Display Advertising report. To view it, just click on “Display Advertising” under “Domain Analytics” in the left-hand sidebar. That report will show you the number of ads you’re running, how many publishers are showing the ads, and the number of times they’ve been seen. You’ll also see other relevant data, such as display ads by device, publisher URLs, and the activity trend.
Display advertising SEMRush report

SEMrush Report – Traffic Analytics

The Traffic Analytics report offers some great detail but keep in mind at this time it only shows data from desktop traffic. To view the report, click on “Traffic Analytics” under “Domain Analytics” in the left-hand sidebar. If you use Google Analytics, the report will look familiar. It breaks down your traffic by sources:
  • Direct – people who visited your site by typing the URL into a browser
  • Referral – people who clicked a link on another site to get to your site
  • Search – people who found your site from the search results
  • Social – people who clicked a link to your site from a social media site or app
  • Paid – people who visited your site from an ad
The report will also show you other import stats about your traffic over time, such as the number of visits, unique visits, the average number of pages per visit, the number of visits by country, and the average visit duration.

Research Keywords Using the SEMrush Keyword Analytics Report

The next category of SEMRush reports is Keyword Analytics. That category also includes numerous reports:
  • Overview
  • Phrase match
  • Related keywords
  • Ad history
  • Keyword difficulty
Keyword Analytics dropdown in SEMRush reports
As with the Domain Analytics category, the Overview report is the executive summary that takes bits and pieces of data from the other reports. We won’t cover it here. We will, however, look at the other reports in some detail. To view keyword analytics type a keyword into the search bar at the top. Then, select “Keyword Overview” from the dropdown just to the left. Finally, click “Search.” The default screen that shows up is the Overview report.

Phrase Match

To view the Phrase Match report, click on “Phrase match” under “Keyword Analytics” on the left-hand sidebar. Unfortunately, if your keyword uses multiple words, you might have to change it in the search bar at the top. That’s a problem with the SEMRush tool. For example, if your keyword is “marketing automation,” you might notice that SEMRush changed the keyword to “marketing+automation” at the top. You’ll have to change it back and hit Enter. In fact, you’ll need to do that every time you click a link under “Keyword Analytics.” At the top of the Phrase Match report, you’ll see some important metrics:
  • Volume – monthly searches for that search term per month
  • Number of results – the number of results when people search for that keyword
  • CPC – the cost per click to advertise with that keyword
  • Competition – a number from 0 to 1 that identifies how competitive that keyword is in terms of advertising
Below the metrics, you’ll see a table labeled “Phrase Match Report.” That table shows you other keywords that include your keyword phrase. They’re ranked in descending order by monthly volume. Pro-tip: you can get some great ideas for keywords related to your niche by going through that table.

SEMrush Reporst Can Help You Find Related Keywords

Click on “Related keywords” under “Keyword Analytics” in the left-hand sidebar. The report that appears is the Related Keywords report. The top part of the report is the same as the Phrase Match report, so there’s no need to go over it again. At the bottom of the report is a table labeled “Related Keywords Report.” That’s different than the one in the Phrase Match report. How is it different? In the Phrase Match report, the similar keywords all use the search term in the phrase. For example, if you’re looking at a report for “marketing automation,” you’ll also see “marketing automation report,” “marketing automation for salesforce,” and “marketing automation saas.” In the Related Keywords report, you’ll see related keywords that don’t necessarily use the search term. For example, if you’re looking at a report for “marketing automation,” you’ll also see “what is automated marketing,” “what is marketing software,” and “automated marketing tools.” So it’s worth your while to check both reports for hot keywords that you can use in your content marketing efforts.
SEMRush report
SEMRush report

Ad History

Next, click on “Ad History” below “Keyword Analytics” in the left-hand sidebar. That will bring up the Ad History report. The report looks like a calendar. It shows you the domains (your competitors) who are using the keyword in their AdWords ads. Use that table to see the amount of traffic their ads generated, the amount of money they spent to earn that traffic, and the number of keywords they’re using in their ads. Pro-tip: click on the number in one of the “Ads Keywords” cells. That will show you the keywords that the competitor is using in advertising. Go through those keywords and you might find some great ideas for content marketing.

Keyword Difficulty

The Keyword Difficulty report is important because it tells how challenging it’s going to be to rank for a specific keyword. To view it, click on “Keyword Difficulty” under “Keyword Analytics” in the left-hand sidebar. In the report that appears, you’ll see a table. Since you’re likely only looking at one keyword right now, that table will only have one row.
SEMRush reports keyword difficulty table
You can add additional keywords in the box at the top of the screen. Just click the “Show difficulty” button right below it to see the difficulty of all the keywords. Pay close attention to the “Difficulty %” column. That’s a percentage number that shows you how difficult it is to rank that keyword. The higher the number, the more difficult it is to rank. People generally use the Keyword Difficulty report to find “low-hanging fruit.” That is, they look for keywords that get lots of search results every month but don’t have a high difficulty.

Projects

The last of the SEMRush reports category is Projects. To view the reports, you’ll need one or more projects. It’s beyond the scope of this article to explain how to create projects in SEMRush. However, if you do have a few, you can take a look at the various reports on a per-project basis. Click on one of your projects under “Projects” in the left-hand sidebar. You’ll see a number of boxes that represent different reports:
  • Site Audit – uncovers on-site SEO issues
  • Position Tracking – allows you to track rankings for specific keywords in real time
  • Social Media Tracker – offers detailed analytics on your social media marketing efforts
  • Brand Monitoring – gives you insights into your online mentions
  • On-Page SEO Checker – provides you with a plan to improve page rankings so you can land a spot on Page 1 of the results list
  • Organic Traffic Insights – gives you a detailed list of every keyword your page is indexed for
  • Content Analyzer – shows key metrics, such as the number of backlinks and social engagement, for your content

Wrapping It Up

SEMRush reports can show you where you’re missing out on opportunities to reach the much-coveted #1 spot in the search results. They can also tell you what you’re doing right so that you can double-down on a great strategy. If you haven’t yet started reviewing your SEMRush reports regularly, make it a point to do so today.

Leave a Reply

Your email address will not be published. Required fields are marked *

Welcome To John Lincoln Marketing

Welcome to John Lincoln’s personal website. On this website, we offer courses by John Lincoln, review software, publish articles and videos. You can also learn about John Lincoln’s books, films, book him to speak and contact him. John is directly associated with many of the businesses mentioned on this website and freely discloses this information. 

About the Author

John Lincoln is CEO of Ignite Visibility, one of the top digital marketing agencies in the nation. Ignite Visibility is a 4x  Inc. 5,000 company. Ignite Visibility offers a unique digital marketing program tied directly to ROI with a focus on using SEO, social media, paid media, CRO, email, Amazon and PR to achieve results. Outside of Ignite Visibility, Lincoln is a frequent speaker and author of the books “Digital Influencer” and “The Forecaster Method.” Lincoln is consistently named one of the top digital marketers in the industry and was the recipient of the coveted Search Engine Land “Search Marketer of The Year” award. Lincoln has taught digital marketing and Web Analytics at the University of California San Diego since 2010, has been named as one of San Diego’s most admired CEO’s and a top business leader under 40. Lincoln has also made “SEO: The Movie” and “Social Media Marketing: The Movie.” His business mission is to help others through digital marketing.

Contact John Lincoln

Want to get in touch with John Lincoln? Click Here To Reach Out.

Related Posts