
Top 16 Questions to Ask a PPC Company in 2024
In 2024, choosing the right PPC company is not just about spending your advertising budget. You want to make every cent count towards your business

Since 2007, the use of visuals on the internet has increased by a staggering amount — 9,900%, to be exact. Infographics are undoubtedly part of the equation, and readers (or viewers) want more. If you’re going to invest in an infographic, you might as well do it right. This means creating a valuable infographic while also distributing it appropriately. Here’s how to do both.
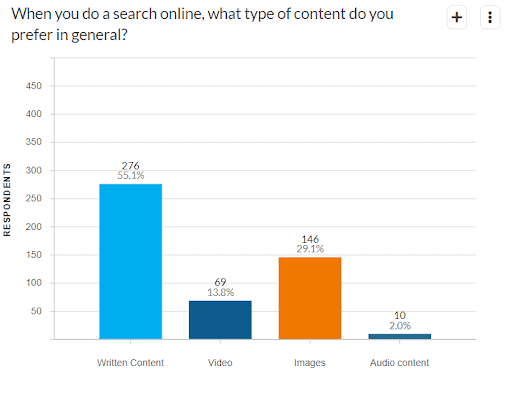
1. Run an industry study. If you want your infographic to be effective, you have to have a reason for making it. Enlist the help of a market research analyst to help you quickly conduct an industry study and come up with some seriously valuable data. This is where the real thought leadership begins.
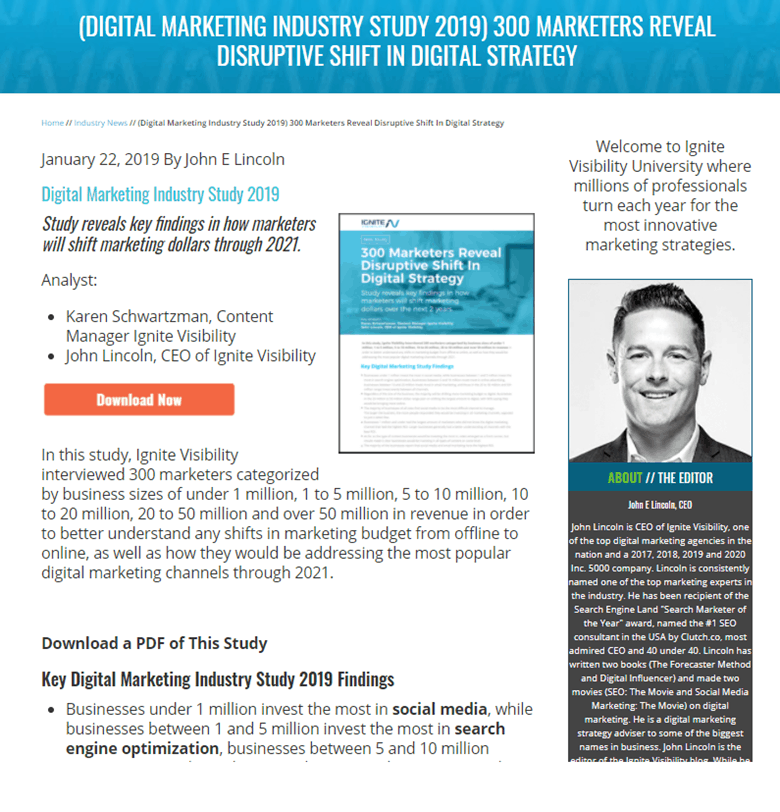
2. Write a blog post. With the readability of an infographic (almost half of your brain works on visual processing) and the SEO capabilities of a blog post, combining the two just makes sense. Write a blog post with the information from your infographic, then include the infographic on the page itself.
3. Make your infographic embeddable — in sections. You want people to share your infographic, so it’s best to set them up for success. Since they’re less likely to share a long, chunky infographic, breaking it up into segments and providing minimal embed code for each is a wise move. Consider watermarking each segment inconspicuously.
4. Offer a downloadable version — for a lead, of course. For anyone who wants to download your research, let them! They may want to use your findings for their own content, ultimately giving you credit and backlinks. Just be sure to capture their email while you’re at it. Even if the content is free, getting an email out of it really benefits your marketing plan. Who knows? They may even convert down the line.
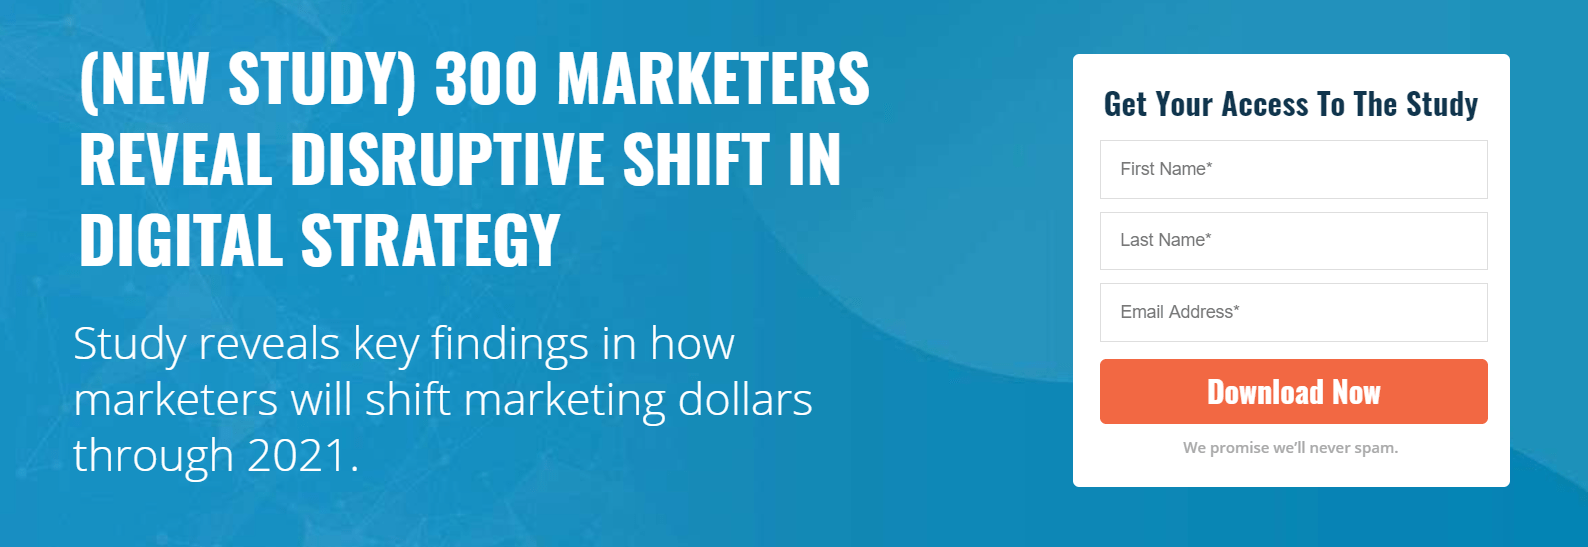
1. Write and share a press release.
By building a press release with your industry study findings, you’ll be able to share the results with professionals across the industry. This includes the media, too (think journalists who may be looking for their next story as we speak).
2. Practice digital outreach.
Look for old posts across the web that tackle similar topics. You can contact them to see if they’re interested in including a free image from your infographic (include a few segments as images in your correspondence). This helps them update their content without any extra cost or effort. It also helps get you a backlink. Boom.
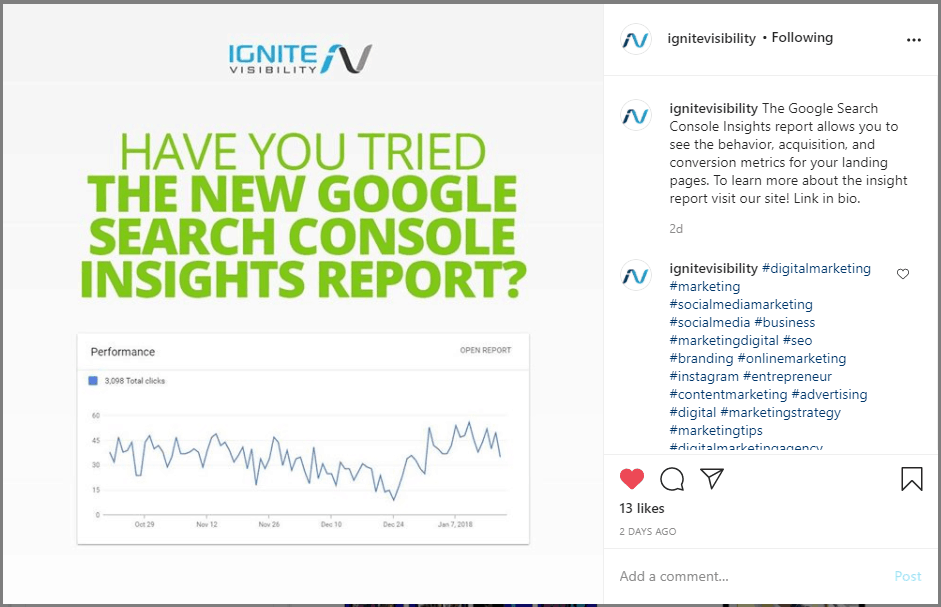
3. Use the infographic segments for social posts.
With a whole range of infographic segments at your beck and call, you magically have a month’s worth of social media content to work with. You can use this across platforms and in various features (like stories), too.
4. Create ads using your data.
For folks in the middle or upper end of the funnel, data-driven ads are a great way to keep the interest. Don’t worry too much about conversions here. We’re vying for reach and resonance.
5. Develop a virtual or live event.
Webinars, Q&A video chats and even live gatherings — whenever those are a thing again — are all a great place to put your infographic data to good use. Build your network and develop your authority in one fell swoop.
6. Use segments from your infographic on your landing pages.
Make your website more compelling by embedding infographic images or data right on your landing pages. Make sure it’s relevant to each page. Consider using it as part of a lead funnel, too — AKA retarget ads to website visitors with even more data.
7. Include the content in your media pitches.
Whether in the form of mini or master infographics, beef up your media pitches with valuable content that shines a good light on your company. Someone could even contact you to use you as a source for their next news piece.
8. Make mailers — off the web.
According to the USPS, more than 60% of people who receive direct mail go on to visit a catalog’s website. That number is proof that everything from postcards to booklets make a difference. Use your data for big returns, and support the USPS while you’re at it.
9. Create banners for buildings or billboards.
Print a snazzy new banner for an office, storefront, billboard or your suppliers’ buildings. Include a succinct piece of data from your infographic that really gets to the point.
Short on content for your marketing endeavors? Use the infographic creation process — including the industry study you used to acquire the data — as a way to produce a plethora of omnichannel content. From social media to the mailbox on the street, this is your way of bringing value (not fluff) to your content marketing strategy.

In 2024, choosing the right PPC company is not just about spending your advertising budget. You want to make every cent count towards your business
Whether you’re a seasoned marketer or just starting out, conversion rate optimization (CRO) is a powerful tool that can boost your sales, leads, and overall

Feeling overwhelmed by the sea of SEO companies out there? You’re not alone! Choosing the right partner is crucial for achieving your online marketing